One of the many reasons traders love TradingView is the ability to customise the colours and layout of charts. Arguably, this is what has set TradingView apart from other charting platforms. An endless array of options are enabled to allow traders to select what works best for them.
How to customise your TradingView charts
To customise your chart, you will have to enter a chart. In the visuals of this demonstration, you will see that I have chosen the US Dollar index, otherwise known as DXY.
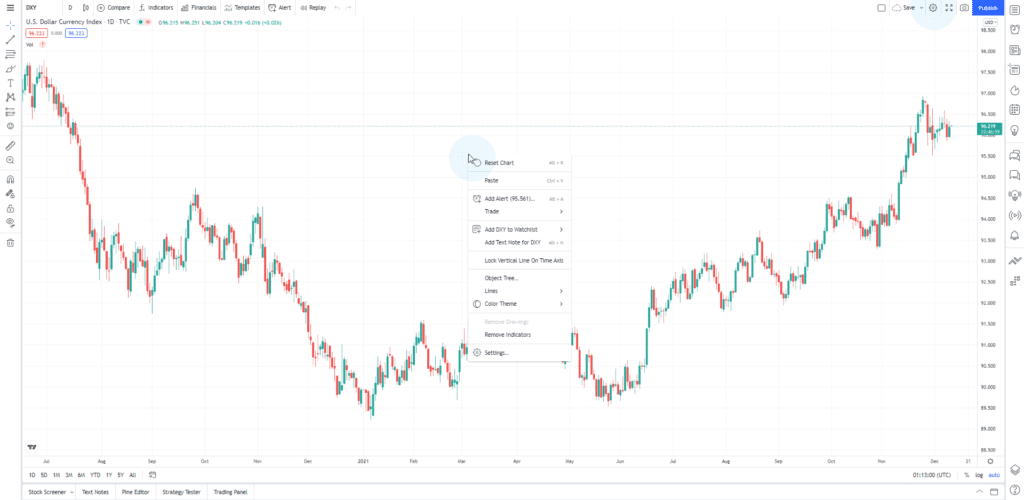
To bring up the customisation setting, you have two choices.
You could right-click anywhere on the chart and select the ‘Settings…’ option. Or, you could click the cogwheel icon in the top right corner of the browser (next to the blue ‘Publish’ button). The results will be the same no matter how you access the settings.
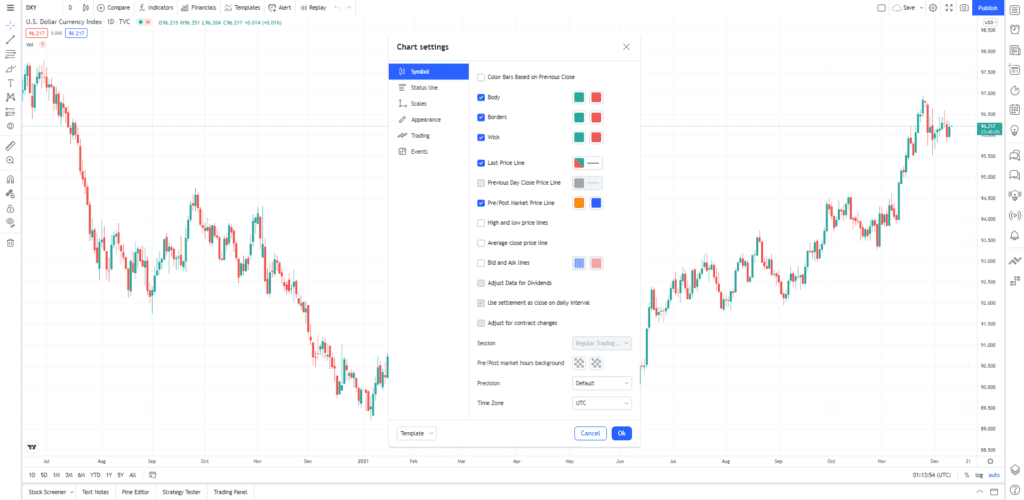
You will now see the settings window prominently on the screen. Within this window are six tabs, each dealing with the settings of different functions of the graph. You will see in a minute that while the charts are highly customisable, the settings menu is straightforward to navigate and manage.
Six Settings options
Under Symbol, you will find the options to change the colour and feel of the most important part of your charts – The candles! Additionally, you can select whether you want to display information concerning the price of the instrument you are charting (such as Bid and Ask prices) and the colour in which this information appears.
A quick tip: Pair the choices you make here with the options under ‘Appearance’. With these two tabs, you can make the most visually impactful changes to your charts.
Status Line
The Status line refers to the information displayed in the chart’s top left corner. Under this tab, you can choose to display the Ticker, the daily value change, and the list of indicators employed on the chart. Perhaps the most important feature is the ‘Show Buy/Sell Buttons’. With the Buy/Sell buttons enabled, you can quickly enter and exit positions.
Scales
Under the Scales tab, you will find a myriad of options to refine the information you want to be displayed on the X and Y-axis value or complement indicators and economic events that may be present on the chart. Pair the decisions you make under this tab with those made under Appearance.
Appearance
Appearance is a critically important tab for customising your chart. Under Appearance, you have control of the chart background colouring, background grid options, and the axis colouring and sizing.
Interestingly, you can insert a watermark that denotes the instrument and the time frame under this tab. This feature is a favourite of traders that like to share their analysis.
Trading
While you have open trade positions, it is essential you can keep track of your performance. Under the Trading tab, you can customise what information is shown on the chart view for optimised information intake and analysis.
Events
The Events tab may be the most underutilised tab for traders. However, the fundamentals of trading should not be ignored. By enabling the feature under this tab, you can stay ahead of high impact economic events and even go back and analyse how past events have affected prices.
Saving your custom themes
Right-click your chart and find ‘Colour Theme’ to save your theme. Follow the arrow next to this label and click ‘Save As…’. Remember to save your themes under distinctive names to be recalled easily.