Fibonacci Analysis
- Understanding Fibonacci Analysis
Understanding Fibonacci Analysis
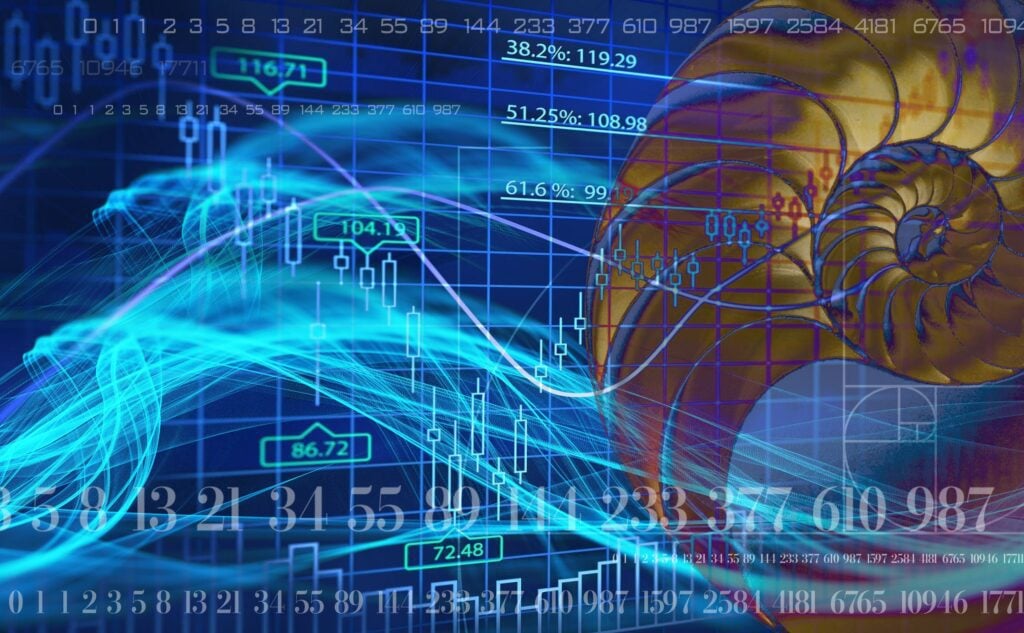
Before diving into examples, let’s recap. Fibonacci analysis is a dynamic and versatile tool rooted in the Fibonacci sequence, a sequence of numbers in which each number is the sum of the two preceding ones (0, 1, 1, 2, 3, 5, 8, 13, 21, and so on). This sequence produces ratios that have proven to be remarkably relevant in the financial markets. These ratios, such as 0.618, 0.786, 1.618, and others, are applied to various aspects of trading, helping traders identify potential support and resistance levels, anticipate price retracements, extensions, and expansions, and even forecast potential reversal zones.
Example 1: Fibonacci Retracements
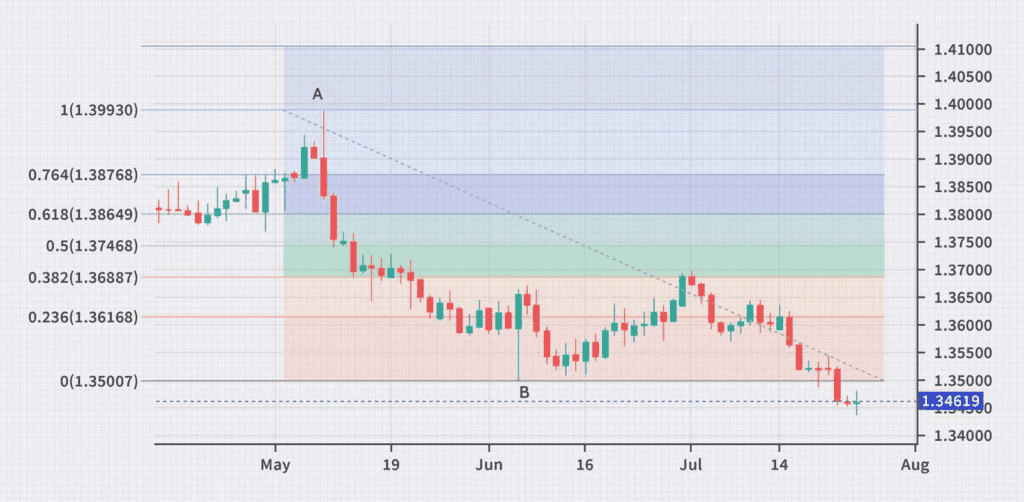
Imagine you’re analyzing an uptrend in a currency pair. You draw Fibonacci retracement levels from the swing low to the swing high. The retracement levels, such as 38.2%, 50%, and 61.8%, act as potential support zones. If the price retraces to one of these levels and shows signs of bouncing, it confirms the presence of a support level.
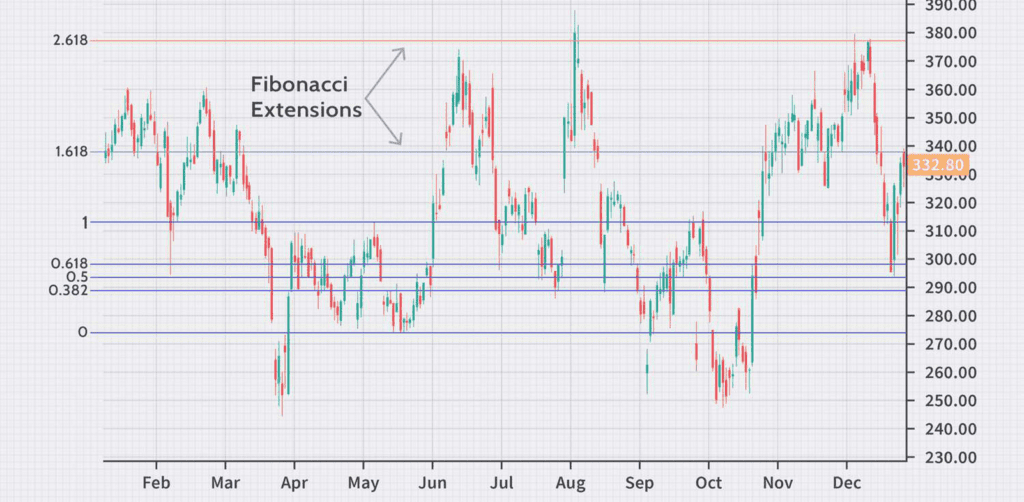
Example 2: Fibonacci Extensions
Now, let’s explore Fibonacci extensions. Consider a downtrend where you draw Fibonacci extension levels from the swing high to the swing low. Extension levels like 161.8% and 261.8% can act as potential resistance zones. If the price approaches one of these levels and stalls, it signals a potential reversal or slowdown.
Applying Your Knowledge:
As you examine forex charts, integrate Fibonacci analysis to identify possible support and resistance levels. Be aware that these levels should not be used in isolation; they should complement other technical indicators and analysis methods.
What’s Next?
Congratulations on completing Lesson 3 of 5! But don’t stop now—there’s so much more to learn.