Chart Patterns
- Understanding Intermediate Chart Patterns

Understanding Intermediate Chart Patterns
Intermediate chart patterns go beyond simple price movements. They provide a visual representation of market psychology and potential shifts in trends. These patterns are formed by connecting price highs and lows over a specific time period.
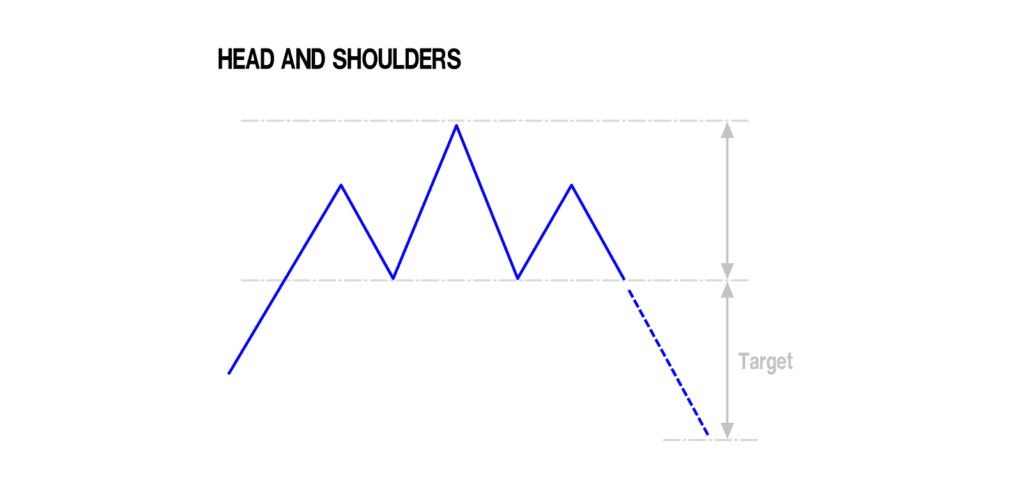
Example 1: Head and Shoulders Pattern
Let’s start with the Head and Shoulders, a powerful reversal pattern. This pattern consists of three peaks – a higher peak (head) flanked by two lower peaks (shoulders). The neckline, drawn by connecting the troughs between the peaks, plays a crucial role. A neckline break signals a potential trend reversal from bullish to bearish.
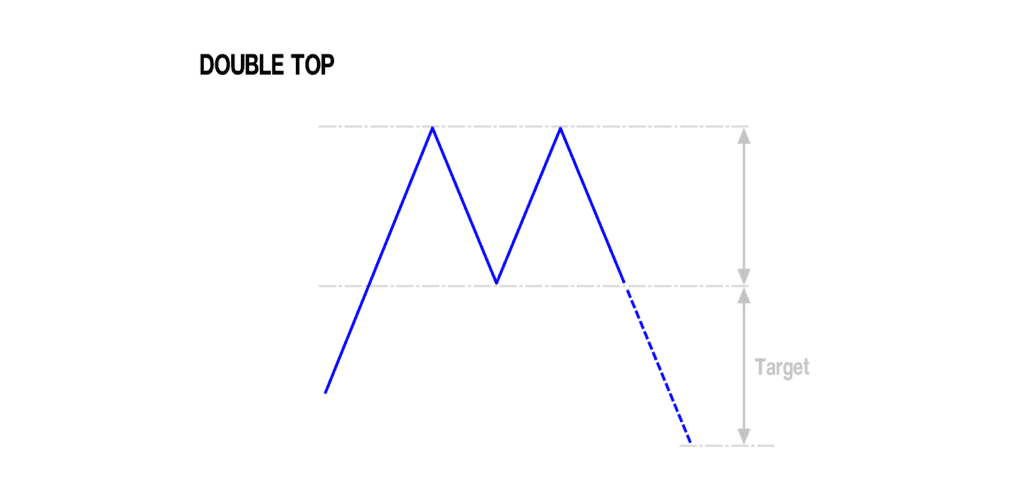
Example 2: Double Top
The double top pattern suggests that the asset’s price has encountered resistance at a certain level twice, failing to break through and continue its upward trajectory. This failure to surpass the previous high can indicate a shift in market sentiment from bullish to bearish.
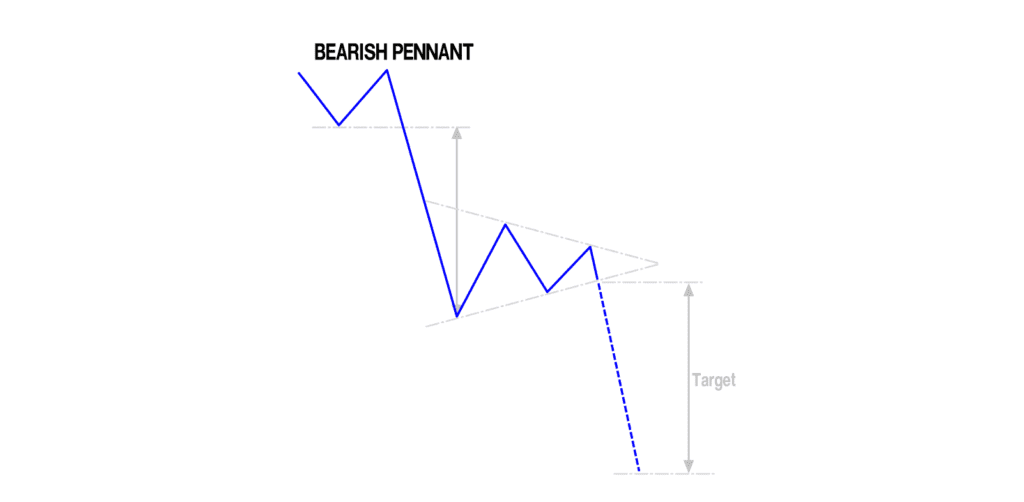
Example 3: Bearish Pennant Pattern
Similar to the flag, the Bearish Pennant is a continuation pattern, but it occurs after a downtrend. It features a steep price decline (pennant pole) followed by a consolidation phase (pennant). A breakout from the pennant’s lower boundary signals a continuation of the previous downtrend.
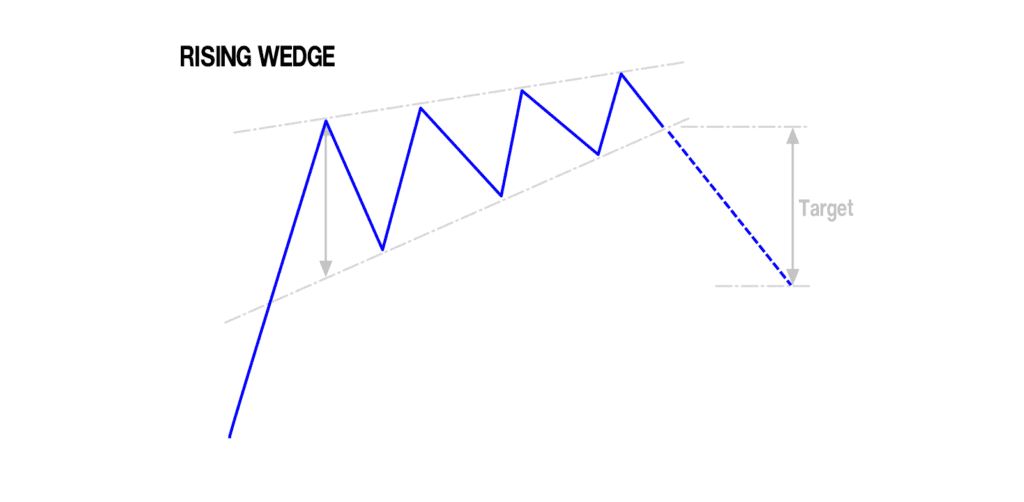
Example 4: Rising Wedge Pattern
Moving on to the Rising Wedge, a potential reversal pattern. This pattern forms when price consolidates between two converging trendlines that slope upward. The breakout from the lower trendline suggests a potential trend reversal from bullish to bearish.
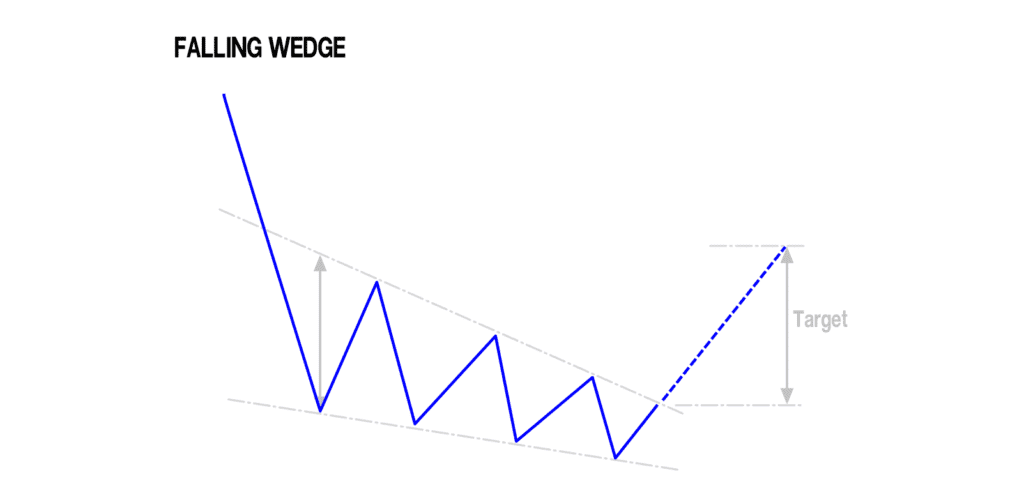
Example 5: Falling Wedge Pattern
Conversely, the Falling Wedge is a bullish reversal pattern. It’s formed by two converging trendlines that slope downward. The breakout from the upper trendline indicates a potential trend reversal from bearish to bullish.
Applying Your Knowledge:
As you analyze forex charts, keep an eye out for these intermediate chart patterns. Each pattern provides unique insights into market sentiment and potential price movements. However, remember that context matters. Analyze the overall trend, volume, and other indicators before making trading decisions based solely on patterns.
What’s Next?
Congratulations on completing Lesson 2 of 5! But don’t stop now—there’s so much more to learn.