Technical Analysis
- Understanding charts
- Understanding technical indicators
- Using technical analysis to make trading decisions
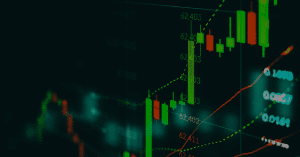
Understanding charts
Forex trading charts are graphical representations of exchange rate data over a specified time frame. They are used by traders to analyze and interpret price movements in the foreign exchange market. Charts display data such as the opening and closing prices, the high and low prices, and the overall trend of a currency pair. The most commonly used chart types in FX trading are candlestick charts. Forex charts can be viewed in different time frames, from one minute to one month, and can be customized with various technical indicators to help traders with their analysis.
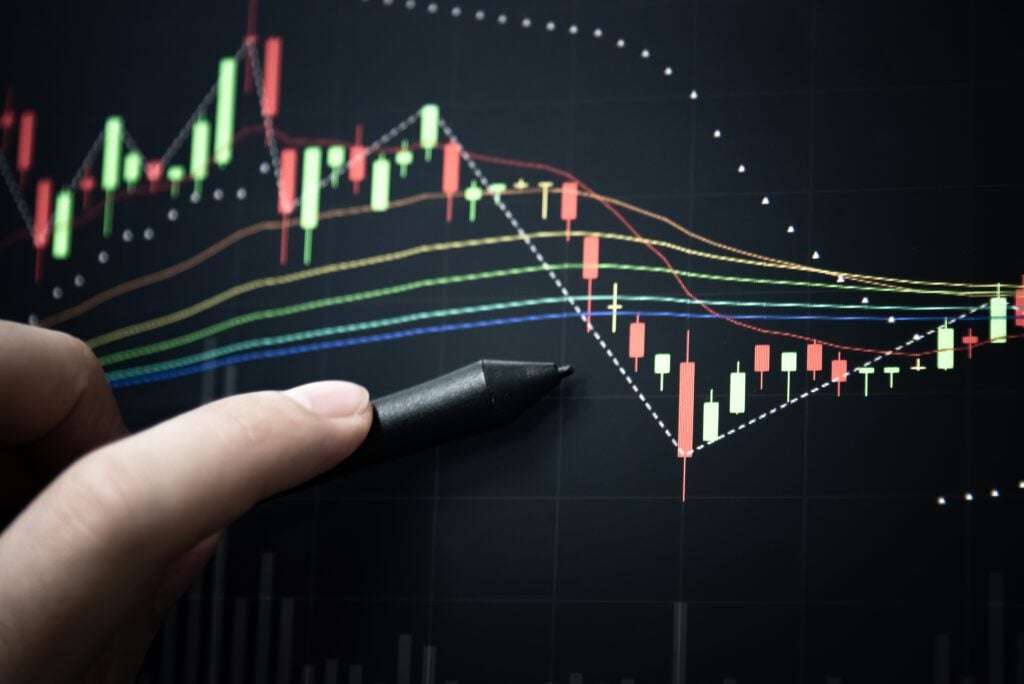
Understanding technical indicators
Technical indicators are graphical elements placed over charts and used by traders to help analyze market conditions and make informed trading decisions. Technical indicators help traders identify trends, measure momentum, and detect potential market reversals. By analyzing past price and volume data, technical indicators can provide traders with a more objective assessment of market conditions and help to minimize the influence of emotions on trading decisions.
Using technical analysis to make trading decisions
Traders use technical analysis to identify patterns and make predictions about future price movements. The following is a general overview of how traders use technical analysis in their decision-making process:
- Identifying Trends: Traders use technical indicators and chart patterns to identify the direction of a trend, whether it is upward, downward, or sideways.
- Measuring Momentum: Technical indicators such as Moving Average Convergence Divergence (MACD) and Relative Strength Index (RSI) can help traders measure the strength of a trend and determine whether it is likely to continue.
- Detecting Reversals: Technical analysis can also be used to detect potential market reversals by looking for chart patterns such as head and shoulders or double tops and bottoms.
- Setting Entry and Exit Points: Traders often use technical analysis to set specific entry and exit points in their trades. For example, they may use a moving average crossover as a trigger to enter or exit a trade.
What’s Next?
Congratulations on completing Lesson 2 of 7! You’ve taken a significant step towards mastering the art of trading and building a successful portfolio. But don’t stop now—there’s so much more to learn.
Happy trading, and see you on the other side of Lesson 3!